Chiswick Set To Lose Councillors in Local Government Shake-up
Local wards projected to see population decline
|
Chiswick looks set to have fewer local councillors by the time of the next election. Data released as part of a consultation on boundaries in the borough of Hounslow predict a declining electorate in some local wards while neighbouring areas are seeing explosive growth.
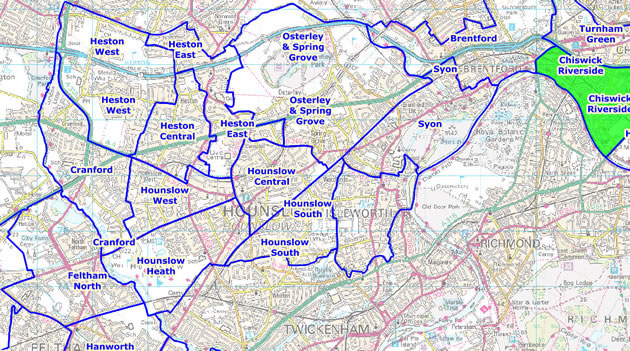
As the Boundary Commission starts its consultation on ward boundaries for the borough of Hounslow, figures show that the electorate of Brentford is expected to increase by 45% while two of the Chiswick wards, Riverside and Homefields) are projected to decrease (see table below).
This population shift could have a far-reaching effect on how local councillors are allocated, as more highly populated areas are in line for greater public representation, according to the recommendations of the commission which states "New wards should leave each councillor representing roughly the same number of voters as other councillors elsewhere in the authority."
One local councillor we spoke to thinks it is possible that Chiswick may see a reduction in the number of seats in each of its wards from 3 to 2, with a new ward created for the Brentford area to cater for its projected increase in population resulting from new developments.
Another senior local Conservative source said they would fiercely resist any reduction in representation for Chiswick. One option that might be proposed would be redrawing the local boundaries so that in order to preserve the quota of nine councillors, Riverside could be extended to the west towards the Kew Bridge side of Brentford, and Homefields to extend into part of Riverside. Turnham Green could stretch further into the North Circular Road.
"Either we lose councillors or we change the boundaries", he said.
The issue will be debated at a full meeting of the borough council in March, which will then vote on the Council's submission to the Boundary Commission.
The combined projected electorate for 2024 of Chiswick Homefields, Chiswick Riverside and Turnham Green wards will be entitled to 7.25 Councillors according the formula used by the Local Government Boundary Commission (LGBC), meaning an almost certain reduction from the current 9 Councillors across Chiswick as a whole. These changes are likely to be made in time for the next local elections which are currently scheduled for 2022.
The projected electorate for Turnham Green ward is boosted by the likely number of new residents by 2024 living in consented or proposed housing schemes which may include the Chiswick Curve and the redevelopment of the B&Q site. The decrease in population for the other two Chiswick wards is thought to be linked to a predicted number of single number households with an aging population.
Over the next six years a 45% expansion of the electorate is being anticipated in Brentford ward with the number of voters rising from 12,107 to 17,565 by 2024. In neighbouring Syon ward there is a 37% increase expected. The massive increase is believed to be a result of large scale property developments planned for the area including the Brentford FC stadium enabling development.
The Boundary Commission says, "New wards should leave each councillor representing roughly the same number of voters as other councillors elsewhere in the authority. New wards should – as far as possible – reflect community interests and identities, and boundaries should be identifiable.
"Consider transport links, community groups and facilities, natural or physical boundaries, parishes and shared interests. New wards should promote effective and convenient local government. Consider the number of councillors for, the geographic size of, and the links between parts of the ward."
The Local Government Boundary Commission public consultation ends on 18 March. The Commission’s consultation portal allows visitors to interact with online maps of the current electoral wards, draw their own boundaries and feed views into the consultation process directly.
Residents are being asked for their comments to inform where the new ward boundaries should be drawn. If the current pattern in Hounslow of 3 Councillors for each ward changes in future, it will be in line with recent reviews of other London Boroughs proposing a mix of one, two and three Councillors per ward. This is said to be necessary in order to allow flexibility to draw up new ward boundaries that properly reflect local community identities.
There will be another consultation on a draft recommendations starting on 4 June, with the publication of final recommendations on 29 October.
You can make a submission to the Hounslow electoral review: through the commission’s consultation area, by e-mailing reviews@lgbce.org.uk, or writing to the following address: The Review Officer (Hounslow), Local Government Boundary Commission for England, 1st Floor, Windsor House, 50 Victoria Street, London SW1H 0TL.
| Name of ward | Number of Councillors per ward | Electorate 2018 | Variance 2018 | Electorate 2024 | Variance 2024 | Projected electorate increase |
|---|---|---|---|---|---|---|
| Bedfont | 3 |
9,756 |
0% |
9,629 |
-13% |
-1.3% |
| Brentford | 3 |
12,106 |
24% |
17,565 |
58% |
45.1% |
| Chiswick Homefields | 3 |
8,511 |
-13% |
8,245 |
-26% |
-3.1% |
| Chiswick Riverside | 3 |
8,760 |
-10% |
8,393 |
-24% |
-4.2% |
| Cranford | 3 |
9,723 |
0% |
9,624 |
-13% |
-1.0% |
| Feltham North | 3 |
8,753 |
-10% |
11,531 |
4% |
31.7% |
| Feltham West | 3 |
11,029 |
13% |
11,511 |
4% |
4.4% |
| Hanworth | 3 |
8,952 |
-8% |
8,908 |
-20% |
-0.5% |
| Hanworth Park | 3 |
9,131 |
-6% |
10,009 |
-10% |
9.6% |
| Heston Central | 3 |
9,417 |
-3% |
10,395 |
-6% |
10.4% |
| Heston East | 3 |
9,314 |
-4% |
12,253 |
10% |
31.6% |
| Heston West | 3 |
9,527 |
-2% |
8,995 |
-19% |
-5.6% |
| Hounslow Central | 3 |
11,677 |
20% |
18,176 |
64% |
55.7% |
| Hounslow Heath | 3 |
10,494 |
8% |
11,471 |
3% |
9.3% |
| Hounslow South | 3 |
8,787 |
-10% |
8,787 |
-21% |
0.0% |
| Hounslow West | 3 |
10,280 |
5% |
11,353 |
2% |
10.4% |
| Isleworth | 3 |
8,977 |
-8% |
9,387 |
-15% |
4.6% |
| Osterley & Spring Grove | 3 |
10,175 |
4% |
10,337 |
-7% |
1.6% |
| Syon | 3 |
10,990 |
13% |
15,079 |
36% |
37.2% |
| Turnham Green | 3 |
8,573 |
-12% |
10,167 |
-8% |
18.6% |
January 16, 2019