Volumes hit record low as agents feel the pain
|
After defying gravity for much longer than many observers predicted, there is now confirmation that Chiswick property prices have moved decisively downwards.
In the second quarter of the year property prices dropped by an alarming 16.5% compared to the previous three months. As in previous periods of uncertainty it is the top end of the market that has suffered the most with no transactions at all taking place involving detached houses and very few for semi-detached. Flats and terraced houses both fell in the region of 11% during the quarter.
The move represents a retracement of all the gains in property prices over the last year. The average level is now 0.8% below what it was 12 months ago.
The news was equally grim for local agents in terms of volume with only 116 properties changing hands in the area in the quarter - the lowest level of turnover on record suggesting that prices may not have reached a clearing level. The volume is half the level seen during the same period last year.
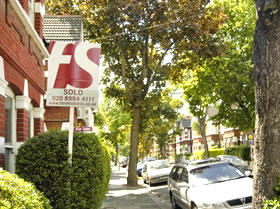
The average price of a Chiswick property is now £523,458 compared to £626,647. The fall in prices and volumes appears to have resulted in increased leafleting and flyboarding from some agents much to the annoyance of local residents.
House prices do remain considerably higher than they were - overall they are still up by 46.% over the last five years.
The average house price in England and Wales stands at £180,781 in June, which is a decrease from last month. House prices in these two countries have fallen for ten consecutive months.
The average property price in London is currently £345,136, which is up 2.5% over the last year although the level has been falling for the last 5 months.
The numbers are subject to revision as usually some properties are added late to the Land Registry's database.
W4 Property Prices - April - June 2008
| Area | Semi-Det | Sales | Terraced | Sales | Flat/ Mais |
Sales | Total Ave. | Total Sales | |
|---|---|---|---|---|---|---|---|---|---|
| W4 1 |
|
3 | 795409 | 11 | 324904 | 11 | 614538 | 25 | |
| W4 2 |
|
0 | 755888 | 9 | 369544 | 12 | 535120 | 21 | |
| W4 3 |
|
4 | 619049 | 10 | 339187 | 8 | 565545 | 22 | |
| W4 4 |
|
0 | 740833 | 3 | 345308 | 19 | 399243 | 22 | |
| W4 5 |
|
0 | 611406 | 15 | 338522 | 11 | 495955 | 26 | |
| Total |
|
7 | 690345 | 48 | 344370 | 61 | 523458 | 116 | |
| Change in Quarter | -18.3% | -56.3% | -11.2% | 6.7% | -11.7% | -4.7% | -16.5% | -7.2% | |
| Change in year | -0.5% | -81.6% | 3.2% | -22.6% | -1.1% | -57.9% | -0.8% | -53.2% | |
| Change in three years | 37.6% | -78.1% | 31.5% | -34.2% | 24.4% | -48.7% | 17.8% | -48.9% | |
| Change in five years | 54.8% | -76.7% | 62.9% | -23.8% | 38.1% | -43.5% | 46.5% | -42.3% |
Roughly speaking the post code sector areas are as follows:
1 - Bedford Park and the north side of the High Road
2 - The south side of the eastern end of the High Rd down to the river at Corney Reach
3 - The Grove Park area and over to Strand on the Green
4 - The west of Chiswick between the A4 and Chiswick High Rd - (a high concentration of flats)
5 - The north west of Chiswick - Acton Green mainly
September 12, 2008
