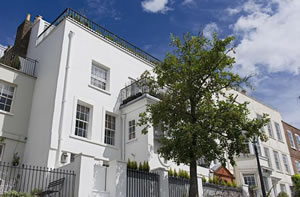
Is this a bubble that needs to keep away from sharp objects?
|
Chiswick property prices continue to surge ever higher according to the latest official figures. One leading local agent has described the current market as a bubble and is urging anyone looking to sell within the next two years to act quickly.
The fourth quarter of 2013 saw the average sale price in the W4 post code area to rise by 30% over the same period last year to £913,360 - a new all-time high.
Flat prices performed particularly well during the quarter and averaged over half a million for the first time ever.
Zachary House on Strand on the Green was sold during the period for £6,850,000 - only Walpole House on Chiswick Mall has gone for a higher price.
Prices in W4 were averaging over a million earlier in the quarter but more recent sales brought the overall level down. This is likely to be caused by technical factors, possibly due to higher priced sales tending to be reported more quickly.
James Leslie, Sales Manager, Faron Sutaria said "We are certainly finding that demand is way outstripping supply for all types of property in Chiswick, which is driving prices up constantly. Our office on Turnham Green Terrace has achieved 102.2% of asking prices so far this year."
Christian Harper, Oliver Finn, "Although thoughts of a general election and the next budget have concerned me with the government making noises around some kind of clumsy ‘brake’ on foreign buyers I now feel that not even they would risk upsetting a £1.24 trillion business (London housing stock value according to Savills study). Yet again I report a huge shortage in stock against a brimming database of buyers which may be further put into turmoil with proposals of not building of flood plains, causing unmanageable demand on London housing. I believe we are certainly in a bubble however I continue to believe that bubbles can keep growing as long as they stay away from sharp objects. "
Christian recommends acting now if you intend to sell within the next two years.
Alastair Hilton of Winkworth stressed the importance of buyers in particular getting a good solicitor at the moment. He said, "With the market in Chiswick moving ever upwards, any delay between agreeing a sale and exchange means there is the potential for a vendor to remarket the property and often for more money. The perennial lack of properties of all types coming onto the market in Chiswick means that we are achieving record breaking prices again and again."
Winkworth have prepared an in depth report on the West London property market. (Note - this is a large file that may take some time to download.
The December data from Land Registry's House Price Index shows that London remains the best performing property market in England and Wales. The average price of a home in the capital rose by 11.2% over the year to £403,972.
For the country as a whole prices rose by 4.4% which takes the average property value in England and Wales to £167,353. Repossession volumes decreased by 28 per cent in July 2013 to 1,187 compared with 1,645 in July 2012.
The most up-to-date figures available show that during October 2013 the number of completed house sales in England & Wales increased by 21 per cent to 71,929 compared with 59,213 in October 2012.
The number of properties sold in England and Wales for over £1 million in October 2013 increased by 40 per cent to 913 from 651 in October 2012.
| Chiswick Property Prices (October - December 2013) | ||||||||||
|---|---|---|---|---|---|---|---|---|---|---|
| Area | Detached | Sales | Semi- detached |
Sales | Terrace | Sales | Flat/ mais |
Sales | Overall Ave |
Overall Sales |
| W4 1 | 2450000 | 1 | 1865446 | 9 | 1168147 | 17 | 522889 | 9 | 1216764 | 36 |
| W4 2 | - | - | 1439119 | 8 | 908524 | 21 | 587777 | 24 | 843370 | 53 |
| W4 3 | - | - | 1610833 | 6 | 1378344 | 16 | 482256 | 21 | 973160 | 43 |
| W4 4 | 2375000 | 1 | 1561658 | 6 | 1652500 | 4 | 443370 | 20 | 878140 | 31 |
| W4 5 | - | - | 840000 | 1 | 968413 | 14 | 466214 | 21 | 671896 | 36 |
| Total | 2412500 | 2 | 1605897 | 30 | 1127205 | 72 | 501031 | 95 | 913360 | 199 |
| Change in Quarter | 44.4% | -80.0% | 6.6% | -9.1% | 14.1% | -24.2% | 20.7% | -11.2% | 9.3% | -18.8% |
| Change in year | -7.2% | -60.0% | 9.6% | 100.0% | 36.8% | 4.3% | 21.6% | -5.9% | 30.0% | 4.7% |
| Change in three years | - | - | 64.8% | 0.0% | 56.4% | 1.4% | 21.2% | 5.6% | 48.3% | 4.2% |
| Change in five years | - | - | 48.2% | 172.7% | 72.4% | 118.2% | 70.8% | 120.9% | 72.3% | 128.7% |
| Change in ten years | - | - | 148.6% | -43.4% | 149.3% | -11.1% | 99.5% | -38.3% | 137.5% | -32.5% |
Roughly speaking the post code sector areas are as follows:
1 - Bedford Park and the north side of the High Road
2 - The south side of the eastern end of the High Rd down to the river at Corney Reach
3 - The Grove Park area and over to Strand on the Green
4 - The west of Chiswick between the A4 and Chiswick High Rd - (a high concentration of flats)
5 - The north west of Chiswick - Acton Green mainly
February 24, 2014
